investor
relations
chairman’s statement
As a result of the group restructuring in 2024, which involved the acquisition of 100% of RX Wellness Co. Ltd and a reduction in the shareholding in M.K. Real Estate Development Plc (“MK”), the 2025 financial performance of FNS Holdings Plc. reflects, primarily, developments in the health and wellness business.
2025 saw an encouraging rise in revenues from Health and Wellness, against the backdrop of relatively disappointing tourist numbers for Thailand as a whole. Bangkok’s tourist arrivals in mid-year were hit by extensive international media coverage of the March 28 earthquake and the collapse of a government building. Tourist sentiment towards Thailand was also impacted by clashes on the Thai-Cambodia border. The relatively strong revenue growth at the flagship RAKxa Wellness Retreat at Bangrachao reflected momentum being generated in direct sales through more focused marketing towards the luxury market in which RAKxa operates. An increasing number of guest referrals and guest postings on social media are also contributing significantly to strengthening the RAKxa brand. Management has focused heavily on better communicating the brand identity, differentiation and value proposition, and this effort is now delivering tangible results.
2025 also saw progress in the second, and more recently launched, wellness property, RX Village, located at Sampran in Nakhon Pathom province. Around mid-year, the decision was taken to reposition this property away from the group and domestic markets towards providing a lower cost alternative to RAKxa, more focused on international markets. RX Village is now positioned to offer a still meaningful, but less comprehensive (and less luxurious) wellness experience to a broader audience, while leveraging the unique cultural heritage of the Sampran area. The repositioning of RXV meant that marketing efforts for the property were curtailed in 2025. However, these have now resumed, with a major push in early 2026.
Outside of the wellness operations, Associate Company, M.K. Real Estate Development Plc. (MK) saw a mixed revenue performance. The residential housing business saw sales fall, reflecting the weak economic backdrop, severe competition in housing and tougher conditions on obtaining mortgage approvals, all of which hit the housing industry. MK’s industrial warehousing business, however, under subsidiary Prospect Development Co., Ltd., showed resilience in the face of the sluggish economy. Revenues from rental fell following the sale of assets to the Prospect REIT, while real estate management fees rose. While MK saw dramatic improvement in earnings at the operating level in 2025, significant financing costs resulted in a loss at the net earnings level.
2025 saw FNS recording gains of the sale of its residual holding in NEO Corporate and on the sale of its stake in the Prospect Logistics and Industrial Freehold and Leasehold REIT, however these gains were not sufficient to offset the losses incurred in wellness and the booking of an impairment against the investment in MK.
At the consolidated level, FNS recorded a net loss of THB 691 million in 2025 on revenues of THB 398 million, against a net loss of THB 426 million in 2024 (excluding Discontinued Operations), on revenues of THB 305 million. Note that the Year on Year comparisons for revenues are distorted by the deconsolidation of MK following the Group restructuring. RX Wellness Co., Ltd. incurred a loss of THB 521 million in 2025, down from THB 1,153 million in 2024. The increase in the Company’s loss in 2025 was mainly due to the share of loss from Associated Companies, mainly from the loss reported at M.K. Real Estate Development Plc.
In addition to the Operating Loss, the Company also recognized negative Other Comprehensive Income relating to the marking to market of the equity holding of M.K. Real Estate Development Plc. This impacted the Shareholders’ Equity in the year-end Balance Sheet, which stood at THB 1,182 million (THB 2.36 per share)
Going forward, 2026 is expected to see positive developments including lower losses at RX Wellness and monetization of real estate assets within MK (both at the parent and subsidiary level).
The key to lower losses at RX Wellness in 2026 is maintaining the sales momentum at RAKxa, building on the trends witnessed in the second half of 2025. Both January and February recorded strong growth in Guest Nights (a combined +77% YoY), however the eruption of hostilities in the Middle East and widespread flight cancellations impacted reservations in March. At this point, it remains uncertain as to the eventual impact of these developments, though it is hoped that a peaceful resolution can be reached quickly. At RXV Sampran, it is too early to say how quickly sales momentum will develop, as this represents a broader (if larger) target market. A series of marketing initiatives are underway to build awareness of RXV and communicate its value proposition. The marketing of an integrative “wellness” experience in Thailand is still a relatively new concept, however market awareness of RXV will be accelerated by both the association with RAKxa and the lessons learnt by the in-house marketing team in building the RAKxa brand. The corporate objective is to achieve full year profitability at RAKxa, at a property level, for the whole of 2026 and have RXV Sampran move into profitability during 2027. Achieving profitability at RX Wellness will be a significant milestone and will likely be transformative in how the business is perceived by outside investors.
In real estate, Prospect Development Co., Ltd.(PD) is planning to sell c.188,000 sqm of completed warehousing to the PROSPECT REIT in 2026, worth c.THB 5.0 billion.
PD is also poised to begin sales of industrial land through its Bangpakong Industrial Estate Joint Venture, which is developing a 977 rais industrial Estate on the Eastern Seaboard. This project will be selling industrial land rather than completed warehousing, which significantly shortens the cash turnaround times for PD.
Meanwhile MK is planning to initiate sales of residential land with medical services at Bangkrachao and has a schedule to monetize non-core assets including residual land plots from the legacy housing business.
Asset sales will reduce MK’s debt, including the repayment of shareholder loans from FNS, and establish MK’s financial independence from FNS.
The growing independence of MK is an important step in the Group’s restructuring and overall business strategy.
FNS’ management continues to believe that “wellness” in Thailand represents a unique business opportunity and to this end, “wellness” will be the focus and future of FNS over the medium to long term.
I would also take this opportunity to thank our shareholders for their support in throughout the group restructuring process and for their support in general.

(Akarat Na Ranong)
Chairman
read more >>
annual reports
form 56-1 reports
form 56-1
CIRCULAR NOTICE
annual summary
financials
| Consolidated Financial Statements | 2025 | 2024 | 2023 |
| Revenues | |||
| Revenues from business operation | 76.7 | 113.9 | 203.2 |
| Revenue from health and wellness | 251.4 | 160.8 | 70.5 |
| Net gain on investments | 17.0 | 1.4 | - |
| Gain on disposal of investment and investment income | - | - | - |
| Other income | 52.8 | 28.9 | 1.3 |
| Total income | 397.9 | 305.0 | 275.0 |
| Costs and Expenses | |||
| Business operation costs and expenses | |||
| Cost of health and wellness | 332.1 | 204.8 | 133.5 |
| Distribution costs | 79.7 | 65.8 | 10.1 |
| Servicing and administrative expenses | 356.2 | 326.9 | 155.7 |
| Other expenses | - | 11 | - |
| Impairment loss on investment | - | 0.0 | 35 |
| Loss on impairment of goodwill | - | 45.4 | - |
| Net loss on investments | 0.6 | - | 52.3 |
| Total costs and expenses | 768.6 | 653.9 | 386.6 |
| Profit (loss) from operations | (370.7) | (348.9) | (111.6) |
| Finance costs | (104.4) | (81.1) | (58.6) |
| Expected credit loss | (1.8) | (6.5) | - |
| Share of profit(loss) from associates and joint venture accounted for equity method | (214.4) | 10.7 | - |
| Gain on disposal of building and equipment | - | - | - |
| Income tax - income (expense) | - | - | - |
| Profit(loss) for the period | (691.3) | (3,401.3) | (170.2) |
| Profit(loss) atttributable to: | |||
| Owners of the parent | (691.3) | (3,048.2) | 997.6 |
| Non-controlling interests | - | (353.1) | (324.5) |
| Earnings per Share (Bt.) | (1.38) | (6.09) | 2.42 |
| Consolidated Financial Statements | 31-Dec 2025 | 31-Dec 2024 | 31-Dec 2023 |
| Total Assets | 2,535.10 | 4,391.1 | 24,684.6 |
| Total Liabilities and Shareholders' Equity | |||
| - Total Liabilities | 1,352.70 | 2,332.70 | 17,067.4 |
| - Total Shareholders' Equity | |||
| - Equity attributable to owners of the parent | 1,182.40 | 2,058.4 | 4,706.1 |
| - Non-controlling interests | - | - | 2,911.0 |
| Total Liabilities and Shareholders' Equity | 2,535.1 | 4,391.1 | 24,684.5 |
| Issued and paid-up share capital (share) | *** | *** | *** |
| 2025 31-Dec 2025 |
2024 31-Dec 2024 |
2023 31-Dec 2023 |
|
| Net Earnings to Total Income | -173.75% | -139.57% | -61.9% |
| Return on Average Total Assets | -16.95% | -2.40% | 0.19% |
| Return on Average Total Shareholders' Equity | -36.22% | -2.58% | -3.07% |
| Debt to Equity (times) | 1.14 | 1.13 | 3.63 |
| Book Value per Share (Bt.) | 2.36 | 4.11 | 9.40 |
quarterly
financials
| Consolidated Financial Statements (Quarterly) | Q3-2024 | Q4-2024 | Q1-2025 | Q2-2025 | Q3-2025 | Q4-2025 | Q1-2026 | % QoQ | % YoY |
| Revenues | |||||||||
| Revenues from business operation | 70.2 | (78.1) | 17.0 | 27.5 | 18.2 | 14.0 | 10.6 | -24.5% | -37.5% |
| Revenue from related parties | - | - | - | 2.5 | 1.2 | (3.7) | 1.2 | n/a | n/a |
| Revenues from sale of real estate | 104.5 | (371.0) | - | - | - | - | - | n/a | n/a |
| Revenues from rental and rendering of services | 196.2 | (550.2) | - | - | - | - | - | n/a | n/a |
| Revenue from management of real estate | 24.4 | (81.6) | - | - | - | - | - | n/a | n/a |
| Revenue from health and wellness | 49.5 | 0.2 | 77.2 | 50.8 | 51.8 | 71.6 | 110.3 | 54.1% | 42.9% |
| Revenue from investments | 0.2 | 1.2 | - | 17.0 | - | - | - | n/a | n/a |
| Gain on disposal of investment and investment income | - | - | - | - | - | - | - | n/a | n/a |
| Gain onvaluation of investment in associate before bussiness acquisition | - | - | - | - | - | - | - | n/a | n/a |
| Gain on Consolidation | - | - | - | - | - | - | - | n/a | n/a |
| Gain on sale of investment property | - | - | - | - | - | - | - | n/a | n/a |
| Other income | 213.5 | (324.9) | 10.8 | 9.1 | 8.7 | 24.2 | 19.7 | -18.6% | 82.4% |
| Total income | 658.6 | (1,404.5) | 105.0 | 106.9 | 79.9 | 106.1 | 141.8 | 33.6% | 35.1% |
| Expenses | |||||||||
| Business operation expenses | - | (11.2) | - | - | - | - | - | n/a | n/a |
| Cost of sale of real estate | 86.4 | (297.6) | - | - | - | - | - | n/a | n/a |
| Cost of rental and rendering of services | 65.2 | (218.1) | - | - | - | - | - | n/a | n/a |
| Cost of management of real estate | 9.2 | (27.4) | - | - | - | - | - | n/a | n/a |
| Cost of health and wellness | 88.9 | (53.4) | 84.4 | 80.2 | 81.7 | 85.8 | 91.4 | 6.5% | 8.3% |
| Distribution costs | 30.7 | (47.3) | 18.6 | 19.5 | 20.5 | 21.1 | 16.8 | -20.4% | -9.7% |
| Servicing and administrative expenses | 320.3 | (457.3) | 99.5 | 76.1 | 88.9 | 91.7 | 82.8 | -9.7% | -16.8% |
| Other Expenses | 28.4 | (98.2) | - | - | - | - | - | n/a | n/a |
| Loss on impairment of investment in subsidiaries | - | - | - | - | - | - | - | n/a | n/a |
| Loss on disposal and write-off of investment in associates | 0.7 | - | (0.7) | - | n/a | n/a | |||
| Loss on impairment of goodwill | 45.4 | - | - | - | - | - | n/a | n/a | |
| Net loss from investment | - | - | - | - | - | 0.6 | - | n/a | n/a |
| Net loss on investment measured at fair value throught profit or loss | - | (65.3) | - | - | - | - | - | n/a | n/a |
| Loss on exchange | - | - | - | - | 0.1 | (0.1) | 6.9 | n/a | n/a |
| Total costs and expenses | 629.1 | (1,230.4) | 202.50 | 176.50 | 191.20 | 198.40 | 197.9 | -0.3% | -2.3% |
| Profit (loss) from operations | 29.5 | (174.1) | (97.6) | (69.6) | (111.3) | (92.3) | (56.1) | -39.2% | -42.5% |
| Finance costs | (271.5) | 696.7 | (31.0) | (28.5) | (24.2) | (20.7) | (18.5) | -10.6% | -40.3% |
| Expected credit loss | (15.8) | 9.3 | - | (1.8) | - | - | - | n/a | n/a |
| Share of profit (loss) from associates and joint venture | 2.8 | (48.9) | (46.4) | (12.8) | (53.7) | (101.5) | (25.9) | -74.5% | -44.2% |
| Impairment loss on investments | - | - | - | - | - | - | - | n/a | n/a |
| Gain on disposal of building and equipment | - | - | - | - | - | - | - | n/a | n/a |
| Income tax expense | (34.5) | 150.4 | - | - | - | - | - | n/a | n/a |
| Profit (loss) for the period from continuing operations | (289.4) | 633.3 | (175.0) | (112.7) | (189.2) | (214.5) | (100.5) | -53.1% | -42.6% |
| Profit (loss) for the period from discontinuing operations | (2,975.5) | ||||||||
| Profit (loss) atttributable to: | |||||||||
| Owners of the parent | (238.2) | (2,225.2) | (175.0) | (112.7) | (189.2) | (214.5) | (100.5) | -53.1% | -42.6% |
| Non-controlling interests | (51.2) | (117.0) | - | - | - | - | - | n/a | n/a |
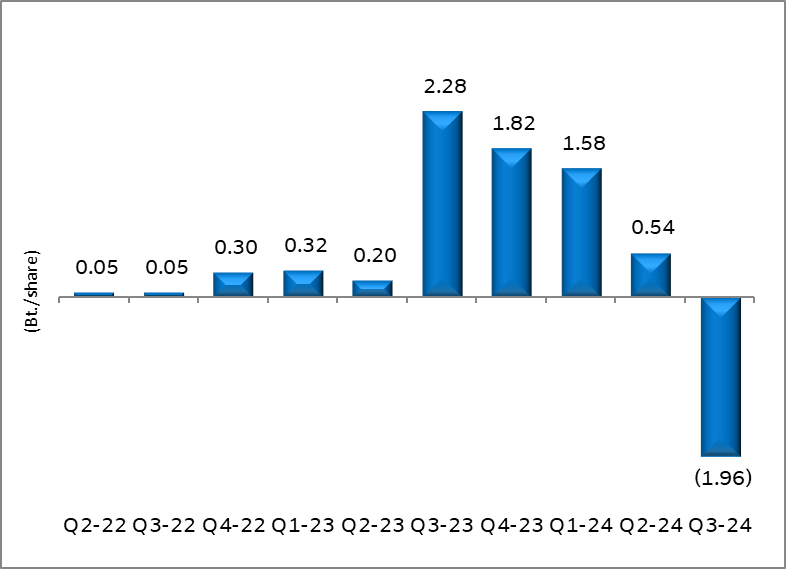
| Earnings per Share (Bt.) | (0.48) | (4.40) | (0.30) | (0.20) | (0.40) | (0.43) | (0.20) | -53.1% | -42.6% |
| Consolidated Financial Statements | 30-Sep-24 | 31-Dec-24 | 31-Mar-25 | 30-Jun-25 | 30-Sep-25 | 31-Dec-25 | 31-Mar-26 | % QoQ | % YoY |
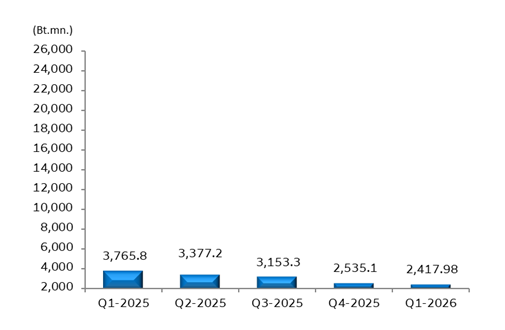
| Total Assets | 25,778.1 | 4,391.1 | 3,765.8 | 3,377.2 | 3,153.3 | 2,535.1 | 2,418.0 | -4.6% | -35.8% |
| Total Liabilities and Shareholders' Equity | |||||||||
| - Total Liabilities | 18,521.9 | 2,332.7 | 2,020.1 | 1,792.8 | 1,715.1 | 1,352.7 | 1,322.8 | -2.2% | -34.5% |
| - Total Shareholders' Equity | |||||||||
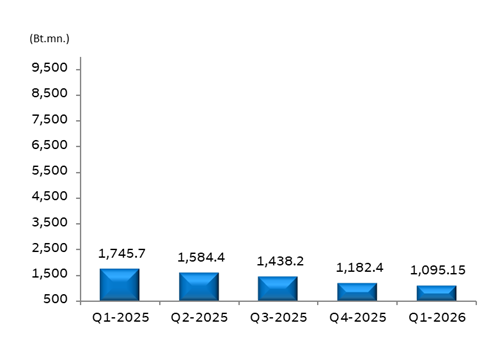
| - Equity attributable to owners of the parent | 4,625.9 | 2,058.4 | 1,745.7 | 1,584.4 | 1,438.2 | 1,182.4 | 1,095.2 | -7.4% | -37.3% |
| - Non-controlling interests | 2,630.3 | - | - | - | - | - | - | - | - |
| Total Liabilities and Shareholders' Equity | 25,778.1 | 4,391.1 | 3,765.8 | 3,377.2 | 3,153.3 | 2,535.1 | 2,418.0 | -4.6% | -35.8% |
| Issued and paid-up share capital (share) | 500,651,065 | 500,651,065 | 500,651,065 | 500,651,065 | 500,651,065 | ||||
| Key Ratios | Q3-2024 | Q4-2024 | Q1-2025 | Q2-2025 | Q3-2025 | Q4-2025 | Q1-2026 | % QoQ | % YoY |
| Net Earnings to Total Income | -36.2% | 158.4% | -166.7% | -105.4% | -236.8% | -173.8% | -71.04% | n/a | n/a |
| Return on Average Total Assets | -0.9% | -2.4% | -4.3% | -3.2% | -5.8% | -17.0% | -16.99% | n/a | n/a |
| Return on Average Total Shareholders' Equity | -13.4% | -2.6% | -25.2% | -18.3% | -33.9% | -36.2% | -36.98% | n/a | n/a |
| Debt to Equity (times) | 4.00 | 1.13 | 1.16 | 1.13 | 1.19 | 1.14 | 1.21 | 6.1% | 4.6% |
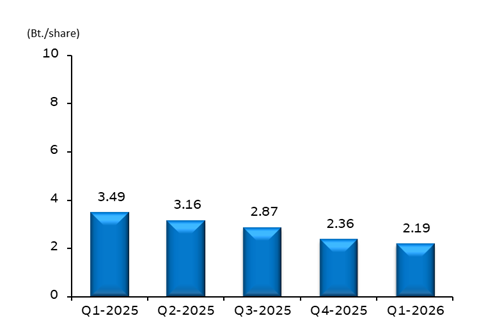
| Book Value per Share (Bt.) | 9.24 | 4.11 | 3.49 | 3.16 | 2.87 | 2.36 | 2.19 | -7.3% | -37.2% |
performance indicators
EPS (ROLLING 12 MONTHS)
TOTAL SHAREHOLDERS’ EQUITY
TOTAL ASSETS
BOOK VALUE PER SHARE
dividends
| Period | Amount | XD Date | Payment Date |
| 1-Jan-22 to 31-Dec-22 | Bt 0.20 | 9-May-23 | 24-May-23 |
| 1-Jan-21 to 31-Dec-21 | Bt 0.50 | 11-May-22 | 27-May-22 |
| 1-Jan-20 to 31-Dec-20 | Bt 0.15 | 11-May-21 | 27-May-21 |
| 1-Jan-20 to 31-Dec-20 | Bt 0.35 | 8-Mar-21 | 22-Mar-21 |
| 1-Jan-20 to 30-Jun-20 | Bt 0.15 | 1-Oct-20 | 14-Oct-20 |
| 1-Jan-18 to 31-Dec-18 | Bt 0.15 | 3-May-19 | 21-May-19 |
| 1-Jan-17 to 31-Dec-17 | Bt 0.15 | 7-May-18 | 24-May-18 |
| 1-Jan-16 to 31-Dec-16 | Bt 0.10 | 3-May-17 | 24-May-17 |
| 1-Jan-15 to 31-Dec-15 | Bt 0.10 | 3-May-16 | 19-May-16 |
| 1-Jan-15 to 30-Jun-15 | Bt 0.20 | 14-Oct-15 | 27-Oct-15 |
| 1-Jan-14 to 31-Dec-14 | Bt 0.10 | 8-May-15 | 25-May-15 |
- Invitation to shareholders to propose the Annual General Shareholders’ Meeting Agenda and Director Nominee in advance
>> For details, Click here(Thai only)